The jupyterhub-usage-quotas system is designed to operate within a Zero to JupyterHub Kubernetes deployment. In the description below we generally make a distinction between two namespaces, Hub and Support, though your particular deployments may differ.
Hub
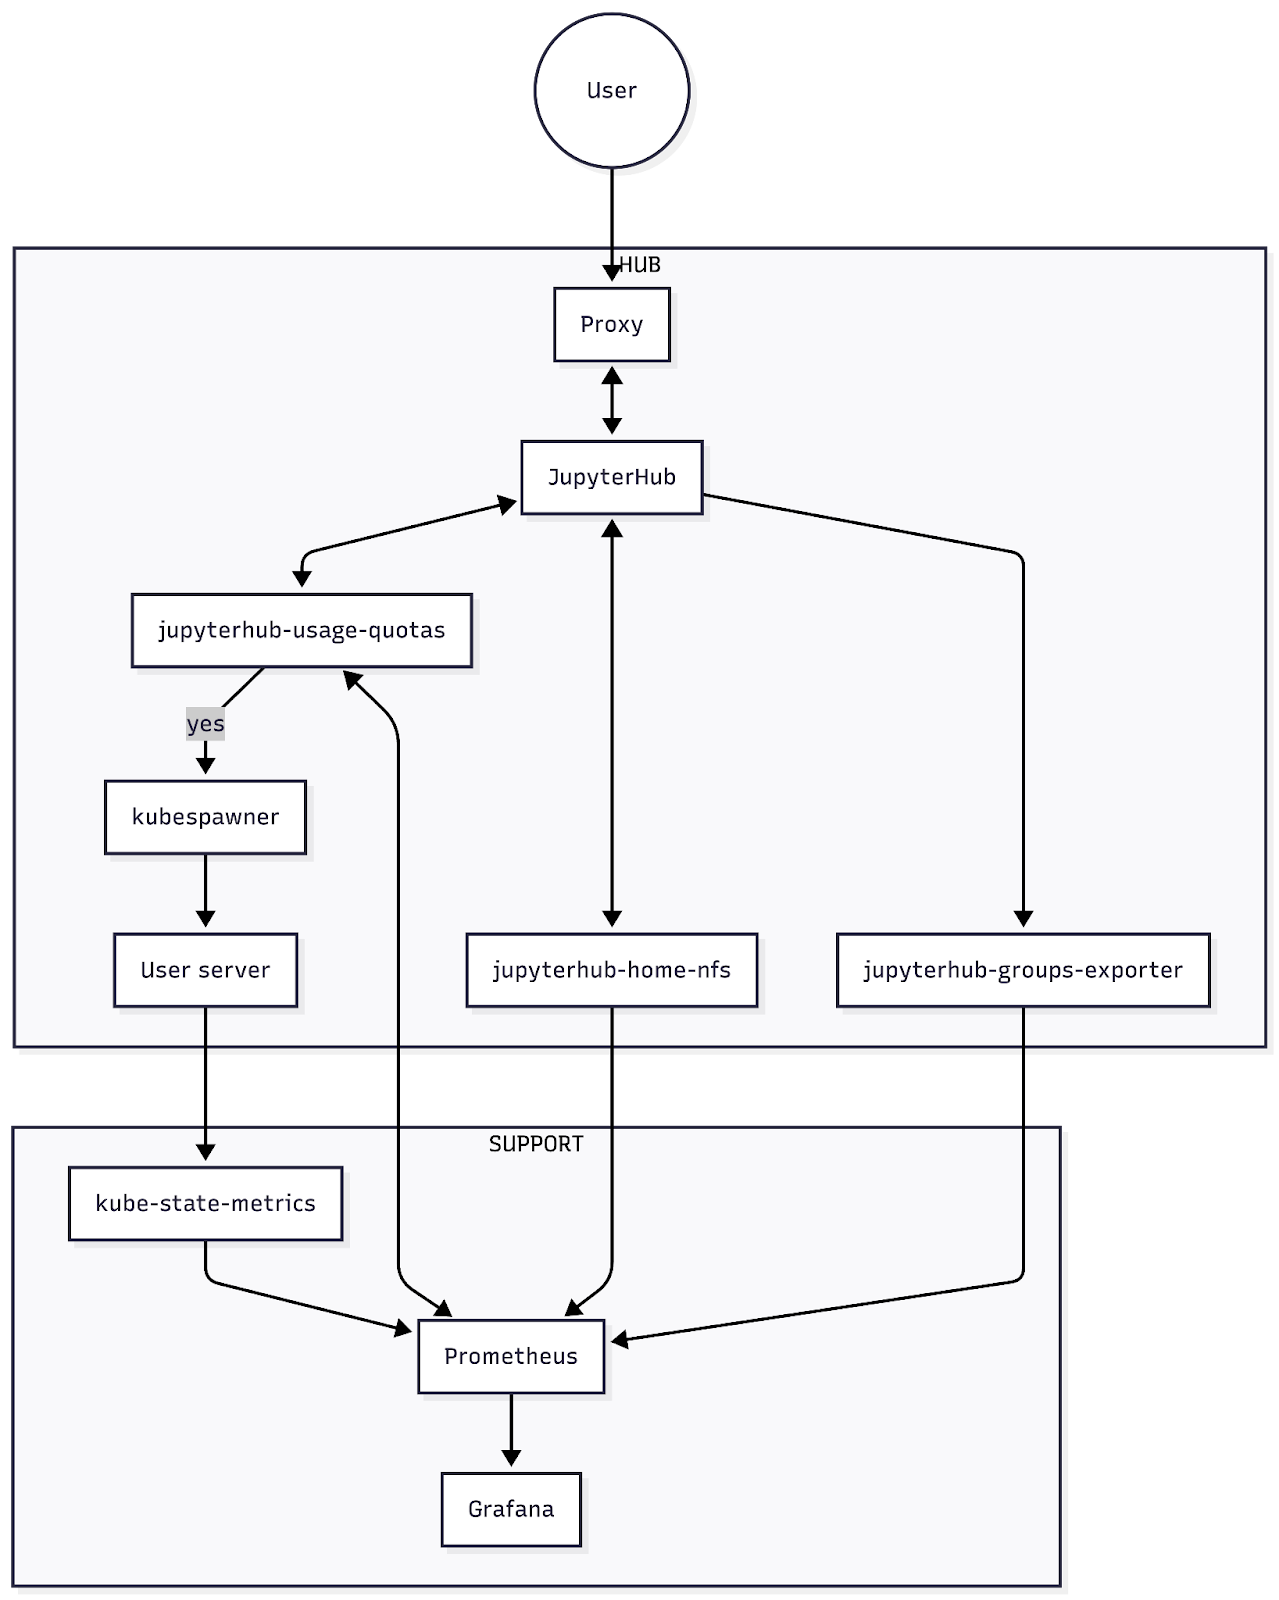
Each cluster may contain multiple hub namespaces, e.g. production, workshop, staging hubs, each running a single hub. The hub namespace contains the user entrypoint to JupyterHub, connected via a proxy. JupyterHub handles user authentication and passes resource requests (i.e. RAM and CPU requests) to the kubespawner to spin up pods to launch single user servers. Critically, the jupyterhub-usage-quotas system hooks into the pre-spawn stage to make yes/no decisions about whether a user can launch a server if they are under/above their usage quota. Usage is calculated by aggregating Prometheus metrics from kube-state-metrics (see Support below). Other components in the hub namespace that can export metrics include:
(optional) jupyterhub-home-nfs, an NFS server for home directories with its own quota enforcement, which exports home storage usage and quota Prometheus metrics
jupyterhub
-usage -quotas itself exports usage and quota limit metrics to be consumed by other services, including the Usage Quota Dashboard
Support
Each cluster can run support components, which we group into a support namespace. One more exporter of interest here is:
kube-state-metrics, which monitors Kubernetes objects, including container memory and cpu requests, and exports them as Prometheus metrics.
Prometheus continually scrapes data from all of these exporters and stores them in a time series database. Services, including jupyterhub-usage-quotas, can consume the data through its API using PromQL, a querying language to select and aggregate data in near real time. Grafana, or AWS CloudWatch Dashboards, are examples of other services that consume Prometheus datasources for visualisation and dashboards.